.png)
An Informed Analysis Puts VOLTAIC First in Warmest Climates
Conventional solar comparisons often rely on identical system size and performance evaluated at Standard Test Conditions (STC) of 25 °C (77 °F). While useful for laboratory benchmarking, this framework does not reflect how roof-integrated solar systems perform in sustained high-heat environments.
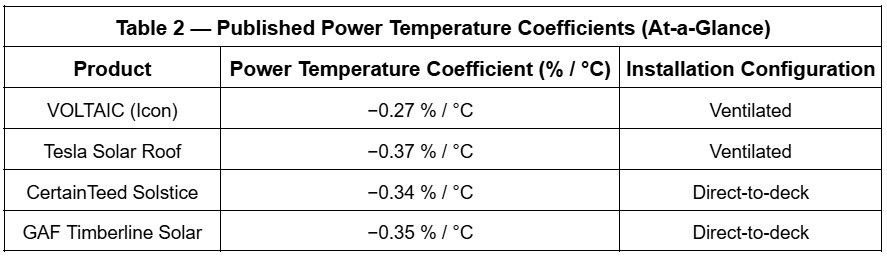
ICON by VOLTAIC carries a power temperature coefficient of approximately –0.27 % per °C.
Tesla is approximately -0.37 % per °C.
CertainTeed Solstice is approximately –0.34 % per °C*
CertainTeed Solstice Datasheet
GAF Timberline Solar approximately –0.35 % to –0.39 % per °C*
*based on published specifications.
The temperature coefficient represents the percentage of maximum power lost for each degree Celsius increase in cell temperature above 25 °C. Lower (less negative) values indicate stronger thermal performance.
In warm climates where rooftop solar cells routinely operate 40–60 °C (72–108 °F) above laboratory conditions, this difference compounds daily.
Cell Temperature vs. Ambient Temperature
Solar modules do not operate at ambient air temperature. They operate at cell temperature, which is typically significantly higher than the surrounding air due to solar absorption and roof heat transfer.
In regions such as South Florida, Arizona, Texas, Southern California, and the Caribbean, rooftop solar assemblies commonly reach 60–80 °C (140–176 °F) during peak summer conditions.
When heat becomes the dominant operating condition, thermal behavior becomes one of the primary drivers of annual energy yield.
Why Temperature Coefficient Matters
Photovoltaic power decreases with heat primarily because voltage declines more rapidly than current rises. While current increases slightly as temperature rises, the voltage drop dominates, resulting in a net reduction in power output. This net effect is captured in the power temperature coefficient.
A system with a coefficient of –0.27 %/°C loses less output per degree of heat rise than one at –0.35 %/°C or –0.39 %/°C.
Over a 50 °C rise above STC, the difference between –0.27 % and –0.37 % becomes material. In sustained high-heat environments, this translates into measurable daily production differences.
Installation Architecture: Ventilated vs Direct-to-Deck
Temperature coefficient is only part of the equation. Installation architecture determines how hot the system operates in the first place.
Some solar roofing systems are installed directly to the roof deck (“direct-to-deck”), limiting airflow beneath the solar surface and increasing sustained operating temperature.
Examples of this architecture include glass-tile solar roof systems such as Tesla Solar Roof, where the photovoltaic tile sits close to the roof deck with only a shallow cavity beneath the module surface. While this configuration maintains a clean architectural profile, it provides less continuous rear ventilation than ventilated solar roofing assemblies.
Ventilated systems incorporate rear air space that allows passive convective cooling.
Field observations and industry thermal studies indicate that ventilated assemblies can operate approximately 11 °C (≈20 °F) cooler than comparable direct-to-deck systems under peak conditions. The exact differential depends on roof pitch, airflow, and installation specifics, but the presence or absence of ventilation materially affects operating temperature.
It is also important to recognize that roof surface temperatures are not limited to traditionally hot climates. During summer conditions, roofs in temperate regions can reach temperatures comparable to—or even exceeding—those seen in subtropical climates. Under full solar exposure, dark roofing materials commonly reach 65–85 °C (150–185 °F) regardless of geographic region.
ICON is installed as a ventilated roofing system.
When temperature coefficient and installation architecture are evaluated together, the difference compounds.
Concrete Thermal Mass and Thermal Stability
ICON integrates photovoltaic cells into a concrete roof tile substrate. Concrete possesses meaningful thermal mass, moderating rapid surface temperature spikes and slowing thermal ramp rates during peak solar loading.
This does not change the modeling assumptions used in the comparative tables below. Rather, it reinforces thermal stability in real-world operating cycles, particularly during sustained heat exposure.
In high-heat regions where roof surfaces can exceed 150 °F, moderated thermal behavior contributes to sustained, stable output rather than sharp midday efficiency drops.
.png)


A More Realistic Hot-Climate Modeling Approach
To reflect real rooftop conditions, this analysis evaluates a 20 kW roof-integrated solar system under consistent assumptions across all products:
• Identical system size and solar exposure
• STC baseline temperature of 25 °C (77 °F)
• Elevated rooftop operating temperatures representative of hot climates
• Published manufacturer power temperature coefficients
• An additional temperature adjustment applied to direct-to-deck systems (≈11 °C / 20 °F)
This approach does not advantage any one product. It acknowledges physical realities that simplified comparisons often omit.
Season-Weighted Annualization (Thermal Penalty Only)
The daily results above reflect extreme hot-roof conditions and are not intended to represent all 365 days of a year.
To translate these findings into an annual perspective without overstating heat effects, we apply a season-weighted approach that annualizes only the thermal penalty (energy lost to heat), not full-year production.
This framework assumes:
• 120 hot-season days operating at the elevated roof temperatures used in Table 3
• 245 moderate-season days operating at 55 °C (131 °F) for ventilated assemblies
• 66 °C (151 °F) for direct-to-deck assemblies (maintaining the same +11 °C differential)
This method isolates temperature behavior while avoiding the incorrect assumption that peak roof temperatures occur year-round.
It also preserves the integrity of the comparative model by focusing specifically on thermal performance rather than attempting to forecast total annual solar production.

What the Results Demonstrate
Under identical high-heat conditions, ICON exhibits:
• Lower temperature-driven power loss
• Higher net daily energy output under extreme heat
• Lowest modeled annual thermal penalty under season-weighted conditions
In the representative 20 kW scenario shown in Table 3, ICON demonstrates a measurable daily production advantage relative to competing integrated solar roofing systems.
Under season-weighted conditions, ICON maintains the lowest modeled annual thermal penalty among integrated solar roofing systems.
Modeling Scope and Assumptions
The modeling presented here isolates temperature behavior under extreme heat. Actual system performance will vary based on site conditions, installation quality, airflow, shading, and regional climate.
The comparative framework does not incorporate every possible variable; it focuses specifically on thermal performance under elevated operating temperatures — the dominant condition in warm-climate solar roofing.
Takeaway
In hot climates, solar roofing performance is not determined by nameplate capacity alone.
It is governed by:
• Temperature coefficient
• Installation architecture
• Sustained operating temperature
• Thermal behavior under load
When these variables are evaluated together — rather than in isolation — ICON demonstrates stronger real-world thermal performance among integrated solar roofing systems.
In the warmest climates, physics matters.
For a full product overview and specifications, see the ICON integrated solar roof page, and for more detail on system engineering, visit our Technology page.
Voltaic Roof Tile
4645 N 32nd Street
Suite 120B
Phoenix, AZ 85015
Voltaic Roof Tile
5227 E. Cheyenne Ave.
Suite 100
Las Vegas, NV 89156
Voltaic Roof Tile
2451 Crystal Dr.
Suite 300
Ft. Myers, FL 33907